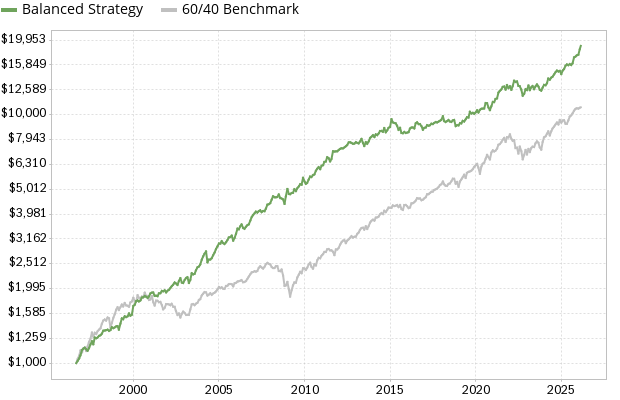
Balanced Strategy Performance (as of 2/20/2026)
The chart below compares the performance of our Balanced investment strategy to a typical “buy and hold” portfolio consisting of 60% stocks and 40% bonds. The Balanced strategy has been consistently profitable, with a compound annual growth rate (CAGR) of 10.5%. An initial investment of $1,000 in 1996 would be worth $19,263 today [1].

| Strategy: |
Balanced |
60/40 Benchmark [2] |
| Compound Annual Growth Rate [1] |
10.5% |
8.3% |
| Standard Deviation [3] |
8.3% |
10.7% |
| Maximum Drawdown [5] |
-17.8% |
-29.8% |
| Sharpe Ratio [4] |
0.91 |
0.54 |
| Growth of $1,000 invested in 1996 |
$19,263 |
$10,690 |
Annual Performance
| Year | Balanced Strategy | 60/40 Benchmark |
| 1997 | 14.05% | 23.53% |
| 1998 | 9.13% | 20.18% |
| 1999 | 20.81% | 11.72% |
| 2000 | 12.30% | -1.49% |
| 2001 | 2.61% | -4.32% |
| 2002 | 10.53% | -7.87% |
| 2003 | 20.69% | 17.73% |
| 2004 | 16.08% | 8.11% |
| 2005 | 9.35% | 3.93% |
| 2006 | 19.02% | 10.52% |
| 2007 | 11.73% | 7.23% |
| 2008 | 13.99% | -14.92% |
| 2009 | 7.26% | 13.18% |
| 2010 | 15.61% | 12.78% |
| 2011 | 15.71% | 7.39% |
| 2012 | 7.56% | 11.06% |
| 2013 | 6.66% | 16.95% |
| 2014 | 8.04% | 11.70% |
| 2015 | -5.18% | 1.36% |
| 2016 | 4.49% | 7.60% |
| 2017 | 7.79% | 14.04% |
| 2018 | -5.07% | -2.34% |
| 2019 | 12.82% | 21.94% |
| 2020 | 10.17% | 14.93% |
| 2021 | 15.65% | 15.92% |
| 2022 | -3.53% | -16.97% |
| 2023 | 4.95% | 17.16% |
| 2024 | 10.58% | 14.68% |
| 2025 | 19.69% | 13.84% |
| 2026 | 8.48% | 1.18% |
Notes
-
The Balanced strategy was made available to subscribers on 3/31/2013. Performance results before this date represent a hypothetical strategy backtest. Strategy performance is tracked and verified by TimerTrac.com. (Note that Allocations made within the past 3 months are only shown to current subscribers).
-
The benchmark portfolio is a typical allocation of 60% U.S. stocks and 40% bonds, rebalanced annually.
-
Standard deviation, also known as historical volatility, is used by investors as a gauge of the amount of expected portfolio volatility. Volatile funds or portfolios have a high standard deviation. When comparing investments, a low standard deviation is preferable.
-
The Sharpe Ratio measures risk-adjusted performance. It's calculated by subtracting the risk-free interest rate from the rate of return for a specific portfolio, and dividing the result by the standard deviation of the portfolio returns. We use U.S. Treasury Bill returns as our risk-free investment. When comparing portfolios, a high Sharpe Ratio is preferable.
-
Drawdown: the peak-to-trough decline in investment or portfolio value, measured as a percentage between the peak and the trough. A good investment strategy aims to minimize drawdowns.
