Over an investing lifetime, expenses add up. Using commission-free ETFs and tax-loss harvesting are just two of the ways that DIY investors can keep their investment expenses in check. To use these techniques, you need to first identify investments that are more or less equivalent to the index that you're trying to track, or the specific fund or ETF that you seek a replacement for. In math-speak, you're looking for an ETF that's highly correlated to a particular index or fund.

For example, let's say you have an account at Charles Schwab, and you're looking for a good index fund that tracks the S&P 500 U.S. stocks index. You've heard about the popular SPDR S&P 500 Index Fund (SPY), but you realize that every time you want to buy or sell any shares, it's going to cost you a $9 commission.
I stumbled across this problem a while ago, while setting up investment accounts for my two teenage children. The "Bank of Dad" got them started with a small account balance, and they make occasional contributions in the $50-$100 range (birthday gifts, savings, etc). They learned (from Bank of Dad, education department) how to set up a diversified portfolio of ETFs. So far, so good, until they realized that they'd be charged a $9 broker commission every time they need to buy or sell any ETF shares. Well, that's not going to work, dad. A $9 commission for every trade is obviously not an option in this case. But even if you're investing larger amounts, these commissions add up over a lifetime, so why not avoid them whenever you can.
Enter zero-commission ETFs. Schwab has a number of low-cost ETFs that track major asset classes, and which can be traded without paying a commission. (And the same is true for other major brokers). Could my children use a commission-free Schwab ETF instead of SPY? The Bank of Dad simply had to answer the question: which Schwab ETF tracks the S&P 500 index (or SPY ETF) most closely?
Now of course brokers will provide you with basic marketing material to guide you in the right direction, but since the Bank of Dad is very demanding and and wants to know exactly how closely these new-fangled Schwab ETFs track their underlying index (and similar ETFs), some analysis was required. But before we roll up our sleeves and crack open the spreadsheet, let's take a look at a few pictures.
A poorly correlated ETF pair
This first one shows you what a poorly correlated ETF pair looks like. I purposely chose two funds that you'd expect to behave differently, U.S. stocks and long-term bonds: the SPDR S&P 500 Index Fund (SPY) and iShares Barclays 20+ Year Treasury Bond ETF (TLT). If you calculate and compare the daily returns of these two ETFs, you end up with this picture:
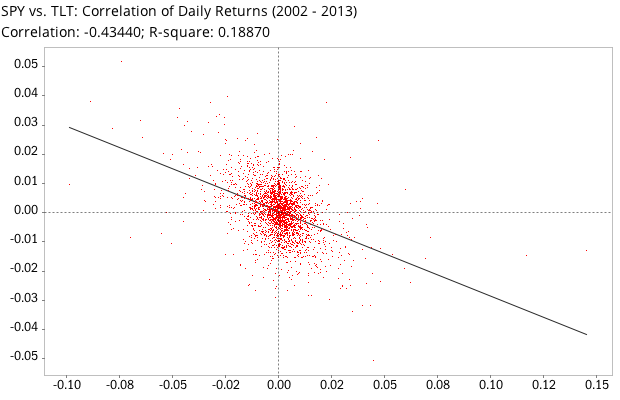
The correlation coefficient (r) is a statistical measure of how much the two investments move in sync. A coefficient of +1.0 indicates a perfectly correlated pair, while -1.0 is perfectly uncorrelated. Using linear regression, we can draw a best fit trendline through the data points.
Each red dot in the chart graphs the daily return of SPY vs. TLT for a particular date. In ballistic parlance, you might call this a shotgun blast pattern: the red dots are scattered "all over the place" and far away from the black trendline. Taking a look at the numbers, the correlation coefficient between SPY and TLT is -0.43. The funds are said to be negatively correlated: when one "zigs", the other often "zags."
As an aside, an ETF pair like this — with a negative correlation coefficient — is a good candidate for a diversified portfolio. If it's portfolio diversification that you're after, a downward slope (negative correlation) and shotgun blast = good.
A highly correlated ETF pair
For the second example, we'll take a look at two funds that have a high correlation. This time, I'm comparing the SPY fund to the Vanguard 500 Index Fund (mutual fund) which tracks the same index. By comparing their daily returns since 1993, we end up with the following correlation chart:
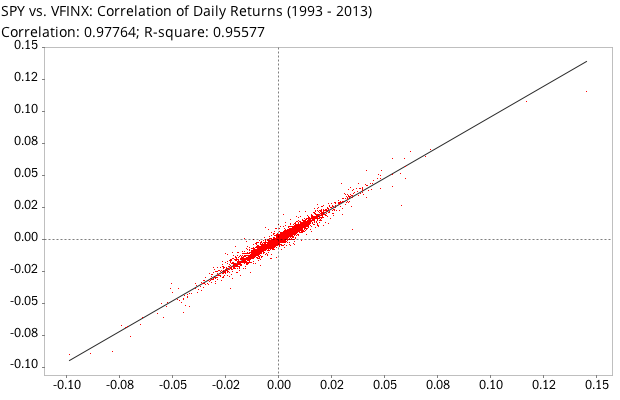
For this handsome couple, the correlation coefficient (r) is 0.978. That's very close to 1.0, which would indicate a perfectly correlated pair. You see that the dots are tightly clustered near the black trendline, in a narrow "squashed ellipse" pattern. This closeness of fit, the upward slope, and the high correlation coefficient indicate a well-correlated pair. After staring at enough scatter plots like these, you recognize that as the linear relationship increases, the "shotgun circle" becomes more and more elliptical in shape until the limiting case is reached (r=1.00 or r=-1.00) and all the points fall on a straight line.
With over 5,000 observations (daily returns to compare since 1993), we have a lot of data points, and can be confident that this is likely to remain an excellent fit in the future.
In practical terms, you can substitute the VFINX for the SPY, and your investment returns will be almost identical.
And the winner is...
Now back to the original question: which commission-free Charles Schwab ETF is the best substitute for the SPY ETF? Running these calculations against all Schwab commission-free ETFs, we turn up two candidates that correlate closely to the SPY fund: Schwab U.S. Large-Cap ETF (SCHX) and Schwab U.S. Broad Market ETF (SCHB). Of the two, the correlation between SPY and SCHX is highest at 0.998, a very well-correlated pair. The SPY and SCHB returns have a correlation coefficient of 0.996, just a little bit lower but still excellent. That makes both of these funds a fine substitute for SPY. As icing on the cake, a quick peek at the annual expenses of these funds reveals that the Schwab ETFs actually have a lower expense ratio than the SPY.
One thing to keep in mind is that the Schab ETFs only started trading in 2009, so we don't have a very long history to compare against SPY. Another 5-10 years and exposure to both bull and bear markets will probably show somewhat greater differences in the correlations. But given the extremely high correlation thus far, I still expect the funds to be good proxies for U.S. large cap stocks.
It's also worth mentioning that neither of the Schwab ETFs tracks the same index as the SPY (the S&P 500). This is good news for investors who are looking to use these funds for tax-loss harvesting purposes. SCHX tracks the Dow Jones U.S. Large-Cap Total Stock Market Index, which includes 750 large cap U.S. stocks (so I guess you can think of it as an S&P 750 if there were such a thing). And the SCHB tracks the Dow Jones U.S. Broad Stock Market Index, which includes the largest 2,500 publicly traded U.S. companies.
Sample spreadsheet with calculations
We wrote software to automate this correlation analysis, and run it regularly on thousands of securities at a time. Among other things, we use it to identify the best commission-free ETFs at all major brokers. But you can get the job done with simple, free tools and data. Here's a Google Drive spreadsheet that you can copy if you want to try it yourself:
To get started, open this link while logged into your Google account (sign up for free if you don't have one). From the File menu, choose "Make a copy" to save it to your own Google account. At this point, you can see the calculations and modify the spreadsheet to your heart's content. It's really quite simple: column A contains the dates, column B and C the SCHX and SPY prices on each date, and in column D and E are the formulas to calculate the daily returns. Finally, with one more function in cell D2, we calculate the correlation between the daily returns over the entire date range. In Google Docs, that formula is CORREL, so in this case we enter =CORREL(D6:D870, E6:E870) in cell D2.
To download free price data for any ETFs or funds, go to Yahoo Finance, type in the fund symbol in the box at the top left of the page, click the Historical Prices link, and download the data as a CSV file. For example, here's the Historical Prices page for the SPY fund. Scroll to the bottom and click the Download to Spreadsheet link. You can now open this CSV file in your favorite spreadsheet app, or upload it to Google Drive. When using Yahoo Finance data, always use the "Adj Close" column, which is the fund price adjusted for splits and dividends.