The Performance Gap
 Mind The Gap! Photo credit: bixentro
That figure is the difference between the annualized return of the U.S. stock market versus the average return of all investors in United States stock mutual funds, over a twenty year period ending in December 2009.
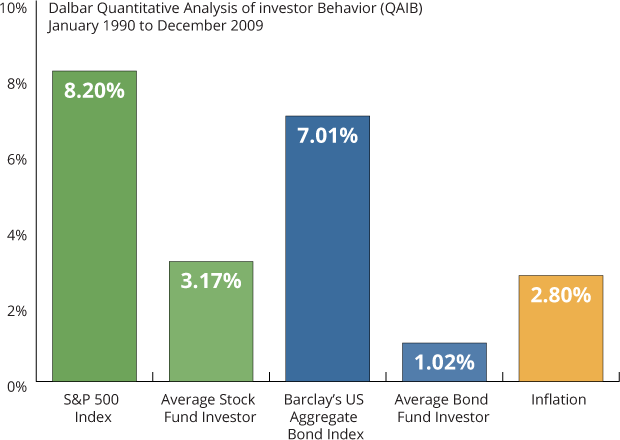
The number comes from an annual study conducted by financial research firm Dalbar. The study found that while U.S. stocks returned 8.20 percent per year over this period, the average stock fund investor only earned 3.17% annually. That’s barely enough to keep up with inflation. When I read the Dalbar report three years ago, my first response was disbelief. Could the performance gap really be this large? More than five percent per year, over two decades? Then I felt sorry thinking about all the investors who lost out on these potential gains.
Dalbar updates this study every year. The numbers change a little, but the conclusion remains the same: massive under-performance by the average investor, year after year. To appreciate the impact of this difference in performance, imagine a hypothetical $10,000 investment made in 1990 (the start of the period studied by Dalbar). During this 20 year period, the S&P 500 index — compounded at 8.20% annually — would have grown to $48,367. By comparison, the average U.S. stock mutual fund investor (under-performing by 5.03% per year) would have ended up with only $18,667, as shown in the chart below:[1]
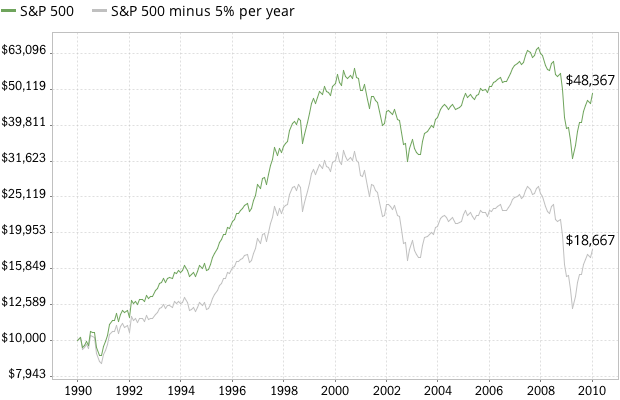
Over longer periods, the differences are devastating. If you assume an investing career that spans 45 years, the stock index compounded at 8.20% would have returned $346,918, whereas the average investor (at 3.17%) would have ended up with only $40,729. Hard to believe, isn’t it?
It gets worse. Dalbar reports that during this period, the average bond fund investor earned 1.02 percent per year, compared to 7.01 percent for the Barclays U.S. Aggregate Bond Index (a broad index that encompasses a variety of government and high grade corporate bonds). Bond investors under-performed by six percent per year!
What causes under-performance?
Part of the blame goes to high investment management fees. You can save over 2 percent per year by choosing low-cost index funds over actively managed mutual funds. The remainder can be chalked up to poor investor decisions. Louis Harvey, president of Dalbar, says that investors “move their money in and out of the market at the wrong times… They get excited or they panic. And they hurt themselves.”
What can be done about it?
In a purely rational world, investors could simply buy a low-cost stock or bond index fund, and be guaranteed to get the market returns (minus a tiny fraction for investment expenses). But that’s where the trouble starts. It’s easy to tell someone that they should just buy and hold a diversified portfolio of index funds. It’s another thing altogether for them to actually stick with that strategy for several decades, through bull and bear markets. Investors are not always rational, and we’re affected by all sorts of behavioral biases, which trip us up despite our best intentions. To succeed with any investment strategy, the first order of business is to learn to control these biases.
Buy-and-hold portfolios go through periods of high volatility, severe drawdowns, and may remain invested in asset classes that are out of favor for a very long time. One way to close the performance gap may be to specifically address these shortcomings:
- Minimize the roller coaster effect. For example, our Balanced strategy incorporates techniques to minimize portfolio volatility and control drawdowns.
- Minimize regret. By constructing a dynamic portfolio from a broad basket of asset classes, and using a trend-following or momentum approach, you improve the odds of being invested in one or more asset classes that are in favor.
What’s most important is that you choose a reasonable investment strategy and actually stick with it. Buy-and-hold may be a fine choice for those who have a long investment horizon, enough risk tolerance, and discipline. For those who don’t, a more systematic and dynamic approach may help to minimize the performance gap.
Notes
- If you’re curious about calculating compound growth, here’s the formula and an example: FV = PV*(1 + r)n, where FV is the future value of the investment, PV is the present (starting) value, r is the compound interest rate, and n is the number of years invested. So for the stock index example compounded at 8.20% for 20 years, we get: FV = $10,000*(1 + 0.0820)20 = $48,367.