Financial markets can be relatively stable during some time periods and extremely volatile during others. One consequence of this is that the risk of a traditional (fixed-weight) asset allocation is highly variable over time. For example, consider the chart below, which measures the standard deviation[1] of daily returns of the S&P 500 U.S. stock index:[2]
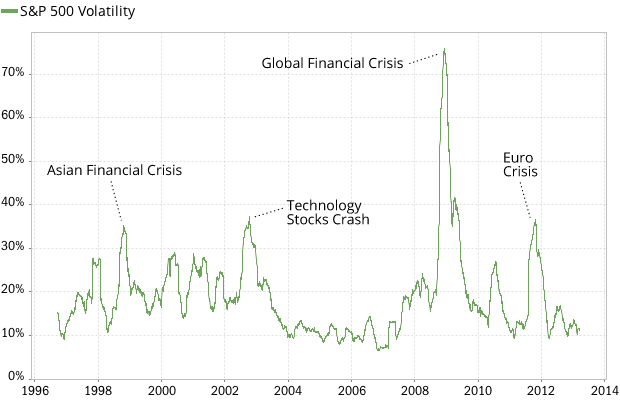
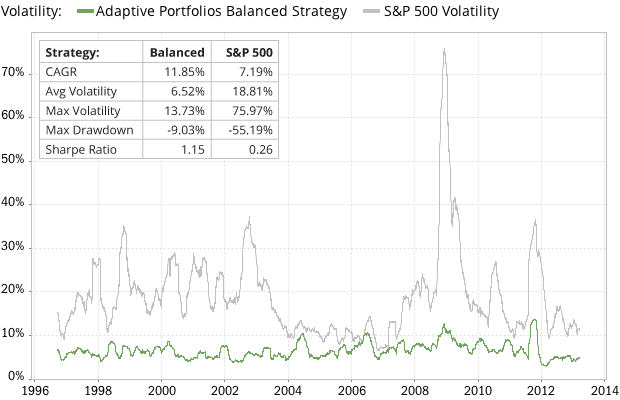
You can see from the chart (and supporting evidence)[3] that during times of crisis, our “baser human instincts” take over as investors run for the exits, causing volatility spikes. S&P 500 volatility, which averages around 18.8%, spiked to as high as 76% during the global financial crisis — 4 times higher than average! If you owned U.S. stocks during this time, you’ll remember receiving month after month of brokerage statements in the red, with seemingly no end to the bad news in sight. It is no wonder that many investors sell their stocks during such turbulent times.
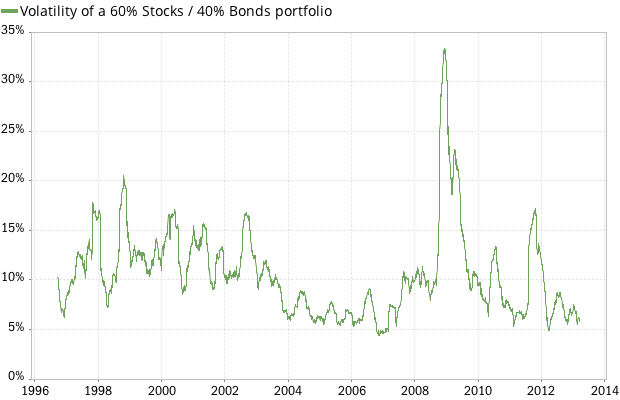
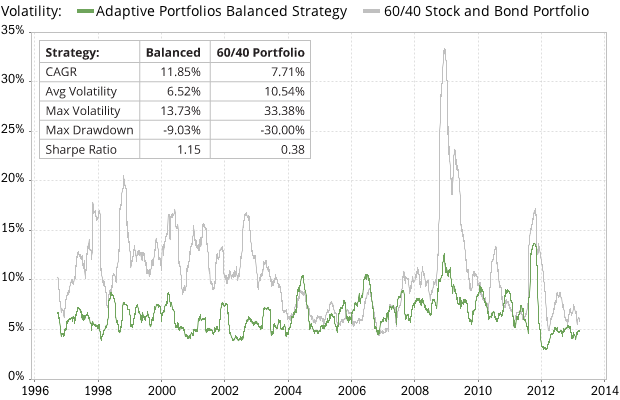
Even a diversified portfolio can exhibit large volatility spikes and variations in portfolio risk. For example, the chart below shows the volatility of a typical portfolio consisting of 60% stocks and 40% bonds:
Why volatility matters
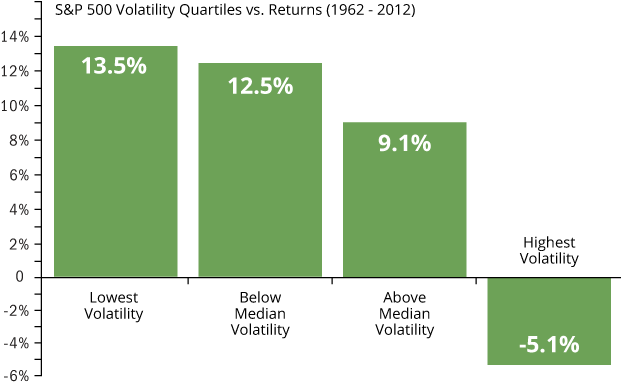
Behavioral investing biases aside, financial researchers have also found that “there is a strong relationship between the level of volatility and the performance of the market. As volatility rises, there is a greater propensity for the stock market to experience losses. Volatility tends to decline as the stock market rises and it tends to increase as the stock market falls.” — Ed Easterling, Crestmont Research
Using market data for the past 50 years, Mr. Easterling goes on to rank volatility into four quartiles, from least volatile to most volatile, to show how expected market returns decline with increasing volatility. It’s clear from the chart that during the lowest volatility market regime, returns are a healthy 13.5%, and during the highest volatility periods they are negative 5.1%:[3]
Volatility Gremlins
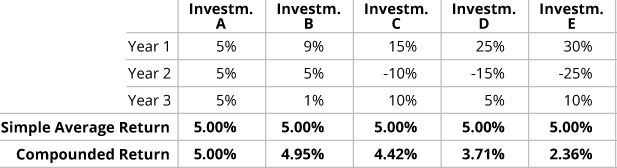
Ed Easterling coined the term "volatility gremlins" to describe the impact of volatility on the growth of an investment portfolio. As portfolio volatility increases and returns become more erratic, the portfolio’s compound returns (“returns you can eat”) get lower and lower compared to the average returns (returns advertised by your friendly Wall Street broker). Here’s an example to show this phenomenon (volatility gremlins “eating your returns”) at work.
Imagine 5 different investments which all have an average return of 5%, but with progressively larger volatility. So for example, Investment A is a bank CD with zero volatility that pays 5 percent every single year (Ha! Remember those days?) and Investment E is the most volatile, with yearly returns of 30, -25, and 10 percent. The average return in all cases is 5%, but watch how the compound return decreases:
The table also shows the impact of large negative returns. If you’re not familiar with the math, here’s a quick example. Let's say you have a $100,000 portfolio. Along comes a bear market, and you lose 50% of your investment. How much do you need to gain in order to get back to break-even? Since your investment value has declined to $50,000, you need to gain $50,000 to get back to $100K. That's a 100% return on investment. It gets progressively worse with larger investment losses, for example, a 75% decline requires an investor to realize a 300% gain just to get back to even.
High volatility in retirement portfolios
It’s not difficult to imagine a scenario where those pesky gremlins wreak havoc on a typical buy-and-hold investment portfolio. Controlling portfolio volatility is especially important for retirees or investors approaching retirement. As you get closer to The Big Day, a major investment drawdown means your portfolio won’t have enough time to recuperate, which may require you to postpone retirement to make up for the shortfall.
Retirees often require regular withdrawals from their portfolio to pay for living expenses. High portfolio volatility increases the likelihood that a retiree will have to withdraw funds while the portfolio is deep “in the red.” The size of the (remaining) principal determines the number of dollars a retiree can safely withdraw every year. High portfolio volatility and suffering a large portfolio loss therefore requires a reduction in retirement income (and lower standard of living).
Volatility is forecastable
We’ve seen earlier that factors such as momentum are persistent in the near future. It turns out that volatility is even more forecastable.[4] Even simple volatility management techniques add value, for example, calculating recent volatility in an asset class and using this to increase or decrease portfolio exposure. More sophisticated models yield even more accurate estimates.[5]
Managing portfolio volatility
Given that markets perform better during periods that are less volatile, it would make sense to reduce portfolio position sizes for asset classes that exhibit erratic behavior, and increase allocations to those that exhibit calmer behavior. It’s therefore no coincidence that volatility management is one of the cornerstones of our Adaptive Portfolios. We use several techniques to keep portfolio volatility within a narrow band, including:
- reducing portfolio positions (by raising cash) whenever an asset class gets too volatile;
- adjusting position sizes so that each asset or investment contributes an equal amount of portfolio volatility;
- using a portfolio optimization algorithm that penalizes high volatility and drawdowns, so that allocations will shift in the direction of better risk-adjusted portfolios.
To see the result of these volatility management techniques, compare the volatility of our Balanced Strategy to the S&P 500 volatility:
For perhaps a more fair comparison, here’s our Balanced Strategy again, but this time compared to the volatility of a typical 60% stocks and 40% bonds portfolio:
Keeping the gremlins at bay
So we’ve seen that volatility gremlins pop out of the woodwork during bear markets, ever willing to aid unwary investors in dismantling their portfolios, only to taunt and mock them as markets take off again, with the investor on the sidelines, in cash. By using an Adaptive Portfolio, you just may be able to keep those gremlins away from your returns.
Notes
- Standard deviation is a statistic that reflects to what extent an investment's actual periodic returns deviate from its average return. A low value indicates that returns are expected to be in a narrow range, while a higher value indicates that the returns are more dispersed. So for example, stock returns vary greatly from one year to the next (high standard deviation), while AAA government bond returns are typically much steadier (low standard deviation).
- In this post, we calculate volatility as the annualized rolling standard deviation of daily asset returns, using a 3-month lookback.
- Ed Easterling, Volatility In Perspective (January 7, 2013), and Relationship Of Volatility & Market Returns (S&P 500 Index: 1962–Dec 31, 2012)
- For example, see: Russell Research, Volatility-responsive asset allocation (August 2011)
- Andrew Ang, Equities Market Level (2012), pp. 32-35


Comments
To add a comment, please Sign In.